Assessing climate change risk usually involves things like modeling flooding or drought potential, understanding temperature change sensitivity, and hardening against potential sea-level rise. However, assessing policy and regulatory impacts is just as critical for a facility’s sustainability in a changing climate. Industrial sector environmental managers should be aware of their states’ greenhouse gas (GHG) reduction commitments and how fulfilling those would increase sustainability risk to their business.
19 States to Watch
The United States Climate Alliance is made up of a bipartisan coalition of 19 state governors (as of February 2019) who have taken the goals of Paris Agreement as their own. Each state (of which several have been added since their recent January 2019 gubernatorial inaugurations) has committed to implementing policies in line with the Paris Agreement: namely, to reduce greenhouse gas emissions by 2025 to 26-28% below 2005 emission levels. Most of the Alliance states have published specific reduction goals to meet their commitment. Those that have published reduction goals as of the writing of this piece are listed below (information taken from US Climate Alliance 2018 Annual Report):
State | Goal |
California | 40% below 1990 levels by 2030; net 0 GHG emissions by 2050 |
Colorado | 26% below 2005 levels by 2025 |
Connecticut | 45% below 2001 levels by 2030; 80% below 2001 levels by 2050 |
Delaware | (no reductions published yet) |
Hawaii | net 0 GHG emissions by 2045 |
Illinois | (no reductions published yet) |
Maryland | 40% below 2005 levels by 2030; 80-95% below 2005 levels by 2050 |
Massachusetts | 25% below 1990 levels by 2020; 80% below 1990 levels by 2050 |
Michigan | (no reductions published yet) |
Minnesota | 15% below 2005 levels by 2015; 30% by 2023; 80% below 2005 levels by 2050 |
New Jersey | 80% below 2006 levels by 2050 |
New Mexico | (no reductions published yet) |
New York | 40% below 1990 levels by 2030; 80% below 1990 levels by 2050 |
North Carolina | (no reductions published yet) |
Oregon | 10% below 1990 levels by 2020; 75% below 1990 levels by 2050 |
Rhode Island | 10% below 1990 levels by 2020; 45% below 1990 levels by 2035; 80% by 2050 |
Vermont | 50% below 1990 levels by 2028; 75% below 1990 levels by 2050 |
Virginia | (no reductions published yet) |
Washington | 25% below 1990 levels by 2035; 50% below 1990 levels by 2050 |
Power Generation Already Tapped
In many of these states the power generation sector is already experiencing high carbon “taxes” through programs such as the Regional Greenhouse Gas Initiative (RGGI) in the Northeast and mid-Atlantic states and the cap-and-trade program in California. Power generation and the petroleum/natural gas systems sector are still the dominant sources of greenhouse gas emission in Alliance states; however, the existing rigor with which these sectors already are regulated with respect to greenhouse gas emissions would suggest that other emitters like transportation and industrial sectors will draw greater attention from these states’ administrations to meet their committed reduction goals.
A RGGI for Transportation
Transportation sources in the northeast and mid-Atlantic Alliance states will soon become well aware of the recently formulated Transportation and Climate Initiative (TCI), which may end up being a kind of RGGI for transportation sources. TCI’s focus is primarily on fuel standards and fleet and freight efficiency, which could mean increased reporting and carbon offsets on markets that utilize significant truck and rail shipping in and through Alliance states.
Next in Line: Industry
However, industrial markets, being potentially more easily regulated on a point-source basis than transportation, and already a part of the EPA GHG reporting program, will likely face increased scrutiny for carbon reductions and offsets in Alliance states. The chemical, mineral/cement, metals, and pulp/paper industries make up substantial potential targets for enhanced carbon regulation. The map below highlights all reporting GHG emitters in Alliance states within these industries.
Chemical, Cement/Mineral, Metals, and Pulp/Paper Facilities Listed as Significant GHG Emitters in US Climate Alliance States
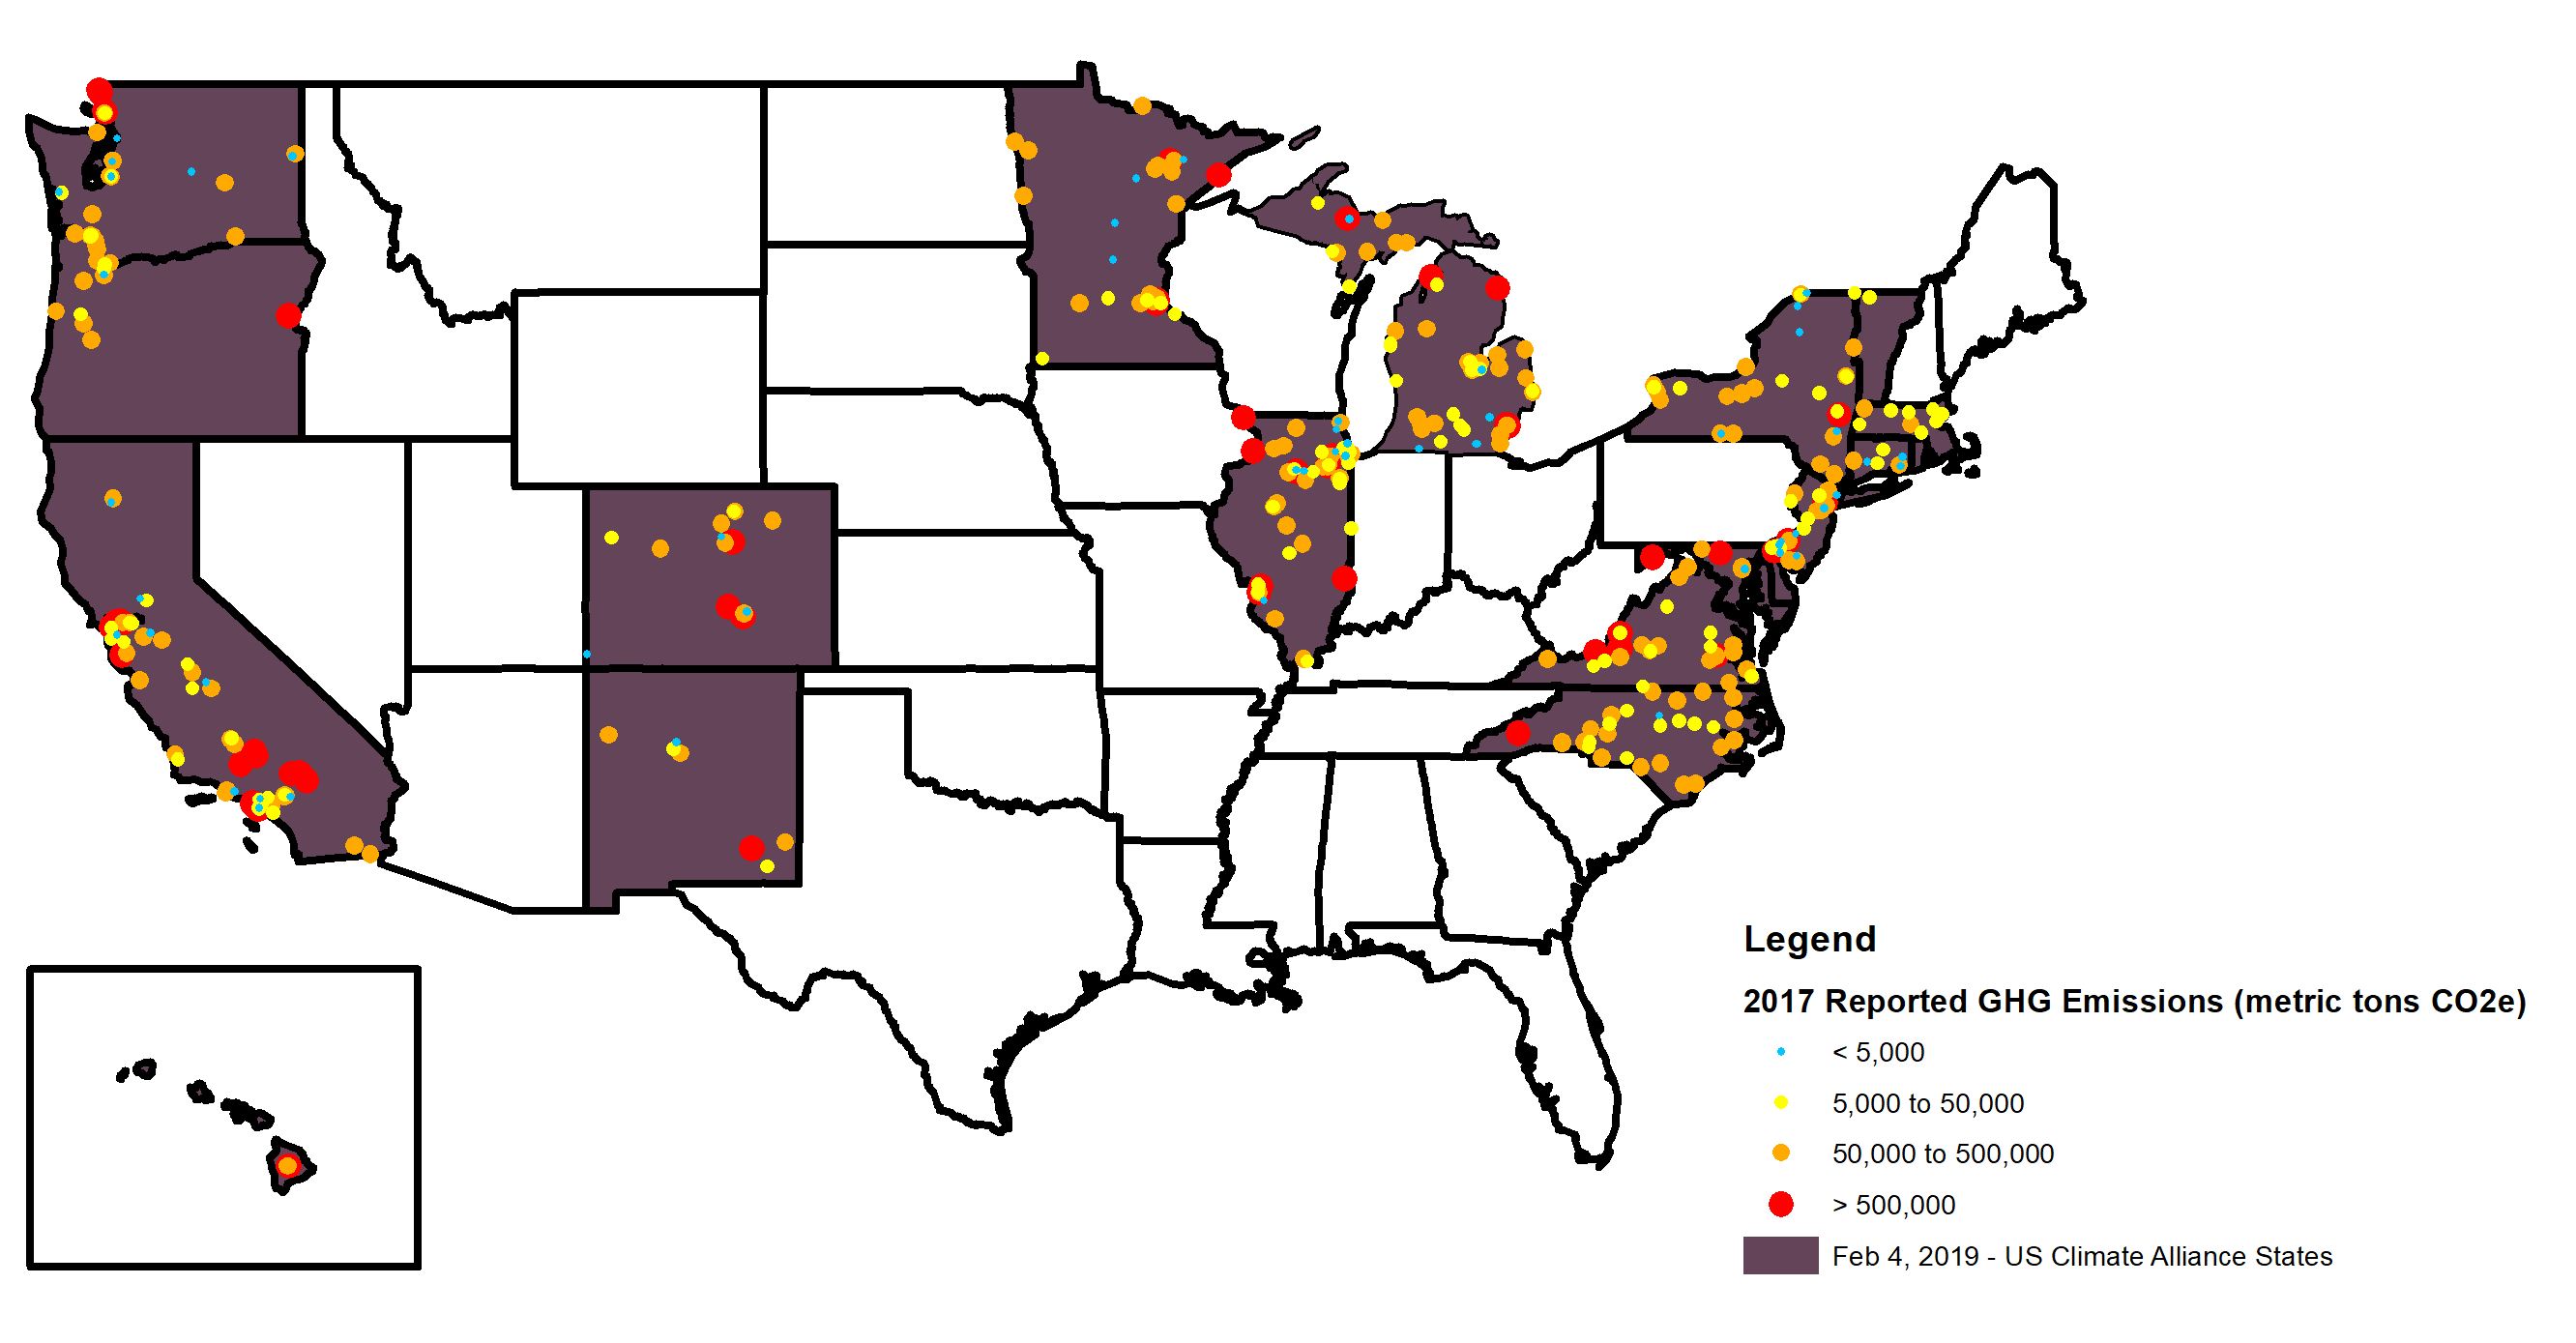
Data sources: US EPA Greenhouse Gas Reporting Program, US Climate Alliance; accessed February 1, 2019.
If they haven’t already, these states will develop regulations and programs to meet their published GHG reduction commitments. Those that have regulations already in place will likely be enhancing and stepping up enforcement efforts of those they have on the books. The industry clients in these states should monitor state executive actions taken and prepare feedback comments on any proposed regulations.
